
Lost in longitude or confused by contour lines? Want to know all the tips and tricks for getting the most out of your atlas? Curious if paper towns still exist? "Ask a Cartographer" is your opportunity to get the facts straight from the source. Tom Vitacco, Rand McNally Publishing’s Director of GIS, is here to answer your burning questions, and geek out over fascinating map lore – one exploration at a time.
This week, we are discussing how cartographers decide what's important enough to include on a map.
Question: How do you decide what information to include on a map and what to leave out?
Tom's answer: Great question! Here's what we take into consideration when deciding what goes on a map:
The information we include on any given map is one of the more important cartographic decisions we make as we attempt to portray spatial data effectively. There are many factors that go into these decisions, including the theme and scale of the map, as well as the data available to display. Plus, the final format, which in our case is usually different paper sizes, also influences our decision-making process because in the end we strive to create an accurate map which is detailed, yet legible.
At Rand McNally Publishing, we create high-quality state maps and atlases in printed formats, and we have a lot of choices to make in relation to map content. Most of our maps are produced within a GIS environment, allowing us to use attribution to assist in these decisions. Our map database has a lot of content and each feature, whether it is a line, point or polygon, has a “numeric content ranking” attribute. The ranking attribute is used for display, and it is keyed to the different product lines we produce.
Ranking Attributes
It might be easier just to provide a few examples of ranking. To start, most interstates or tollways will include a content ranking attribute in our database to ensure these major roads display in all our products. However, a county road might have a ranking attribute to only display on a state fold map because the map scale and paper size are larger. Every road in our map database has a content ranking and this attribute is how we control which roads display on any product or map we produce.
Another example is related to map icons such as rest areas (shown on our maps as a small blue house symbol). We show rest areas on the road atlas and state fold maps, but not the Midsize Easy to Read Road Atlas because the map scale and paper size are much smaller and the maps become too cluttered if we include a lot of symbols and content.
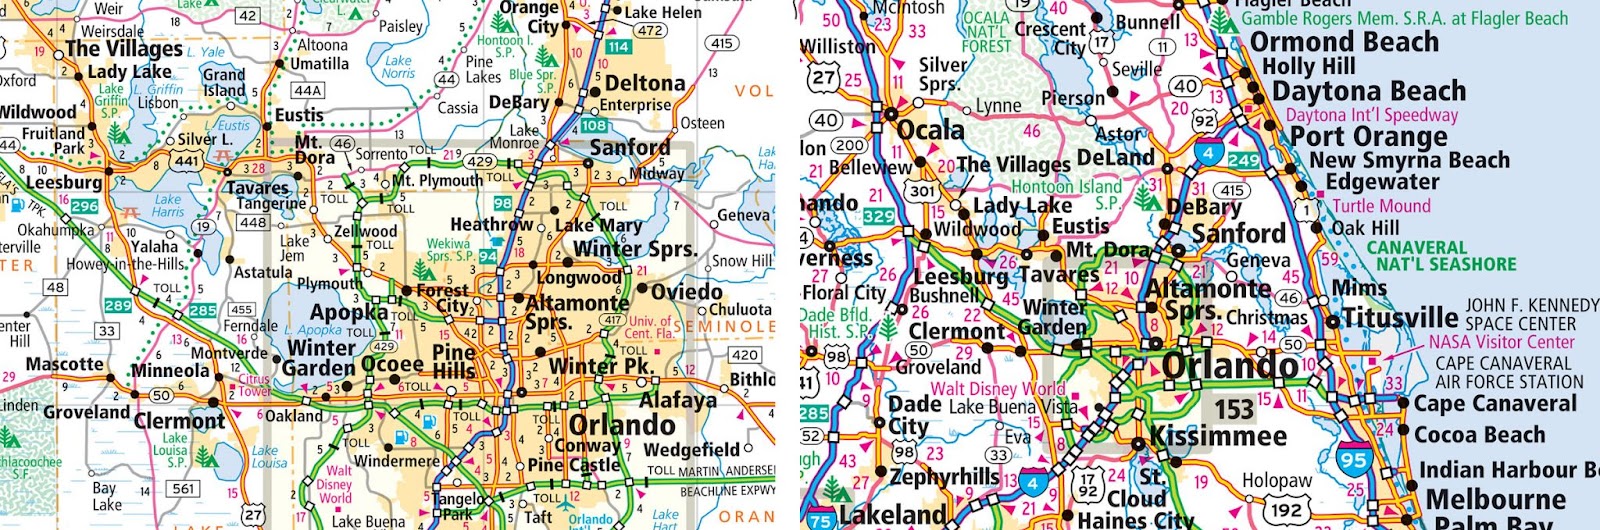
An example of the Florida State Fold Map on the left showing detailed map content and the Florida map from the Midsize Easy to Read Atlas on the right where map content is removed because of scale and paper size.
Maintaining Consistency
Ultimately, the cartographer makes the decision related to the ranking attribute and applies the proper code to the map feature. We could let the computer make that decision for us, but we prefer to have the cartographer make the choice because there are many variables to consider.
A good example would be if you look at our Texas and Rhode Island maps in the Road Atlas. Texas is a large state and Rhode Island is smaller, yet the paper is a set size. The cartographer evaluates the area then selects and ranks the appropriate content for each map to maintain clarity, but more importantly to keep a consistent look and feel to the maps which is important in a road atlas since we display individual states on different pages alphabetically.
Labeling Cities, Towns and Monuments
Labeling the text on the map is another area where the cartographer must focus on the details. Most GIS environments offer automated label placement functionality—meaning the computer will make the decisions on placing labels on the map for city or monument names. The placement rules are set in advance by the cartographer but the computer, in theory, does all the work. However, these name placement algorithms only take you so far and often do not make the best choices for the map. When the cartographer makes the decision on map label placement, the result is often a much cleaner map that is easy to read and contains appropriate map content.
How to Format Long Names
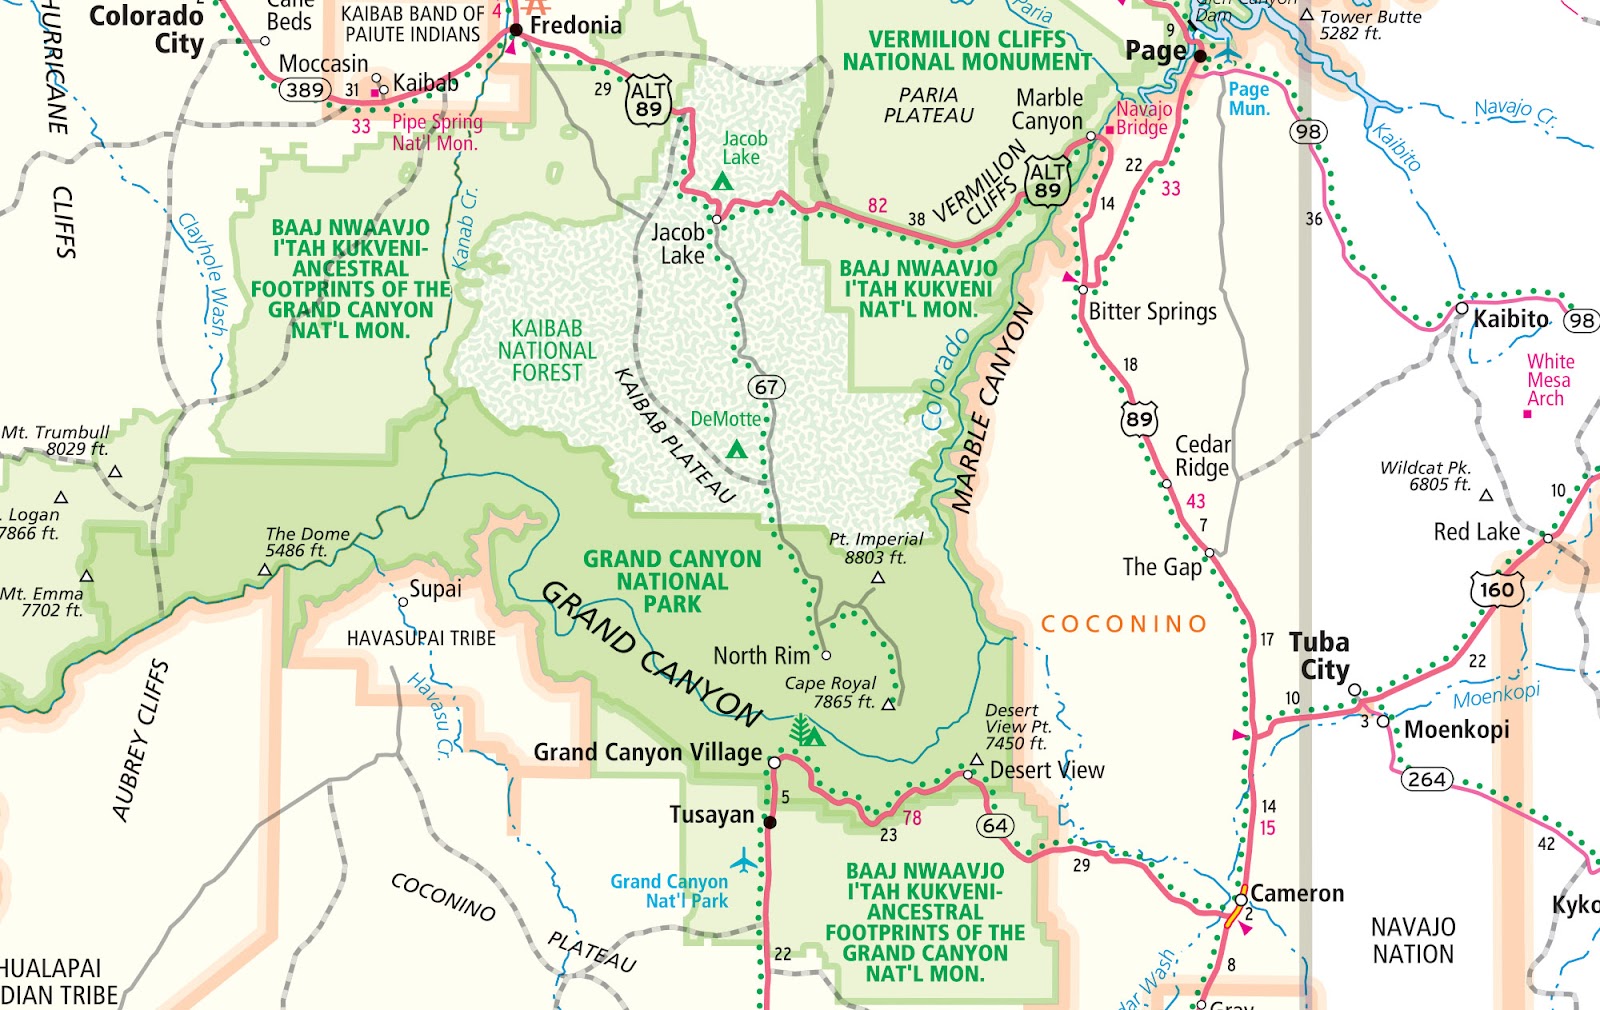
A perfect example of label placement appears in the 2025 Road Atlas product line. We added some new National Monuments and one specific monument in Arizona is called Baaj Nwaavjo I’tah Kukveni-Ancestral Footprints of the Grand Canyon National Monument, shown on our map below in three distinct areas. I believe this is the longest name we have ever added to our maps! Our cartographers manually placed the three labels shown below because they could visually decide where the extremely long label would fit best, plus we abbreviated the name when required. Automated names placement software would not have placed the label in the same manner.
Manual Cartography vs Modern GIS
Decisions on map content were more challenging when I started as a Rand McNally cartographer back in 1986. We only used film at the time and choosing map content was labor intensive, involving hot wax, metal pins, mylar and tools with blades…but that is a story for another time! Honestly, the experience I gained during that era with film layers, CMYK composites and huge cameras truly enhanced my cartographic skills as the transition to digital cartography happened in the 90s. Understanding the details of manual cartography laid the foundation upon which my GIS skills were built, and I am grateful to have worked in both manual and digital cartographic environments throughout my career.
Have a question for our cartographer? Email us at printproducts@randmcnally.com with “Ask a Cartographer” in the subject line and your question could be featured next!